ANALYSIS OF LC OSCILLATORS:

  •     In the general form of a oscillator, any of the active devices such as Vacuum tube, transistor, FET, Operational amplifier may be used in the amplifier section.
  •      Z1, and Z2 are reactive elements constituting the feedback tank circuit which determines the frequency of oscillations.


 also provides temperature stabilization.

  •     The radio frequency choke (R.F.C) offers  very high impedance to high frequency currents i.e., acts like a d.c short and open.
  •     Thus it provide d.c load for collector and keeps a.c. currents out of d.c. s source.
  •     The function of Cc and Cb to block d.c. and to provide an a.c. path.
  •      Frequency determining network is a parallel resonant circuit consisting of inductors L1 and L2 and a variable capacitor C, the junction of L1 and L2  is earthed.


  •     One side of L is connected to base via C and the other to emitter via C So, L the input circuit.
  •     Similarly one end of L is connected to collector via C and other end id connected to emitter via Ce.
  •     So, L is in the output circuit.
  •     The two! are inductively coupled and form an auto ttansformer.

WORKING OF THE CIRCUIT:

  •     When the collector supply voltage is switched on, a transient current  produced in the tank circuit.
  •      The oscillatory current in the tank circuit produces voltage across L in this way a feedback between output and input circuit accomplished through auto transformer action.
  •     So there is a phase reversal of 1800 between output and input.
  •     The common-emitter amplifier also produces a further 180° phase shift between input and output voltages.
  •     Thus total phase shift becomes 360°.
  •     This makes the feedback positive which is the essential condition for oscillations.
  •     When the loop gain | β | of the amplifier is greater than one, oscillations are sustained in the circuit.


FREQUENCY OF OSCILLATIONS:

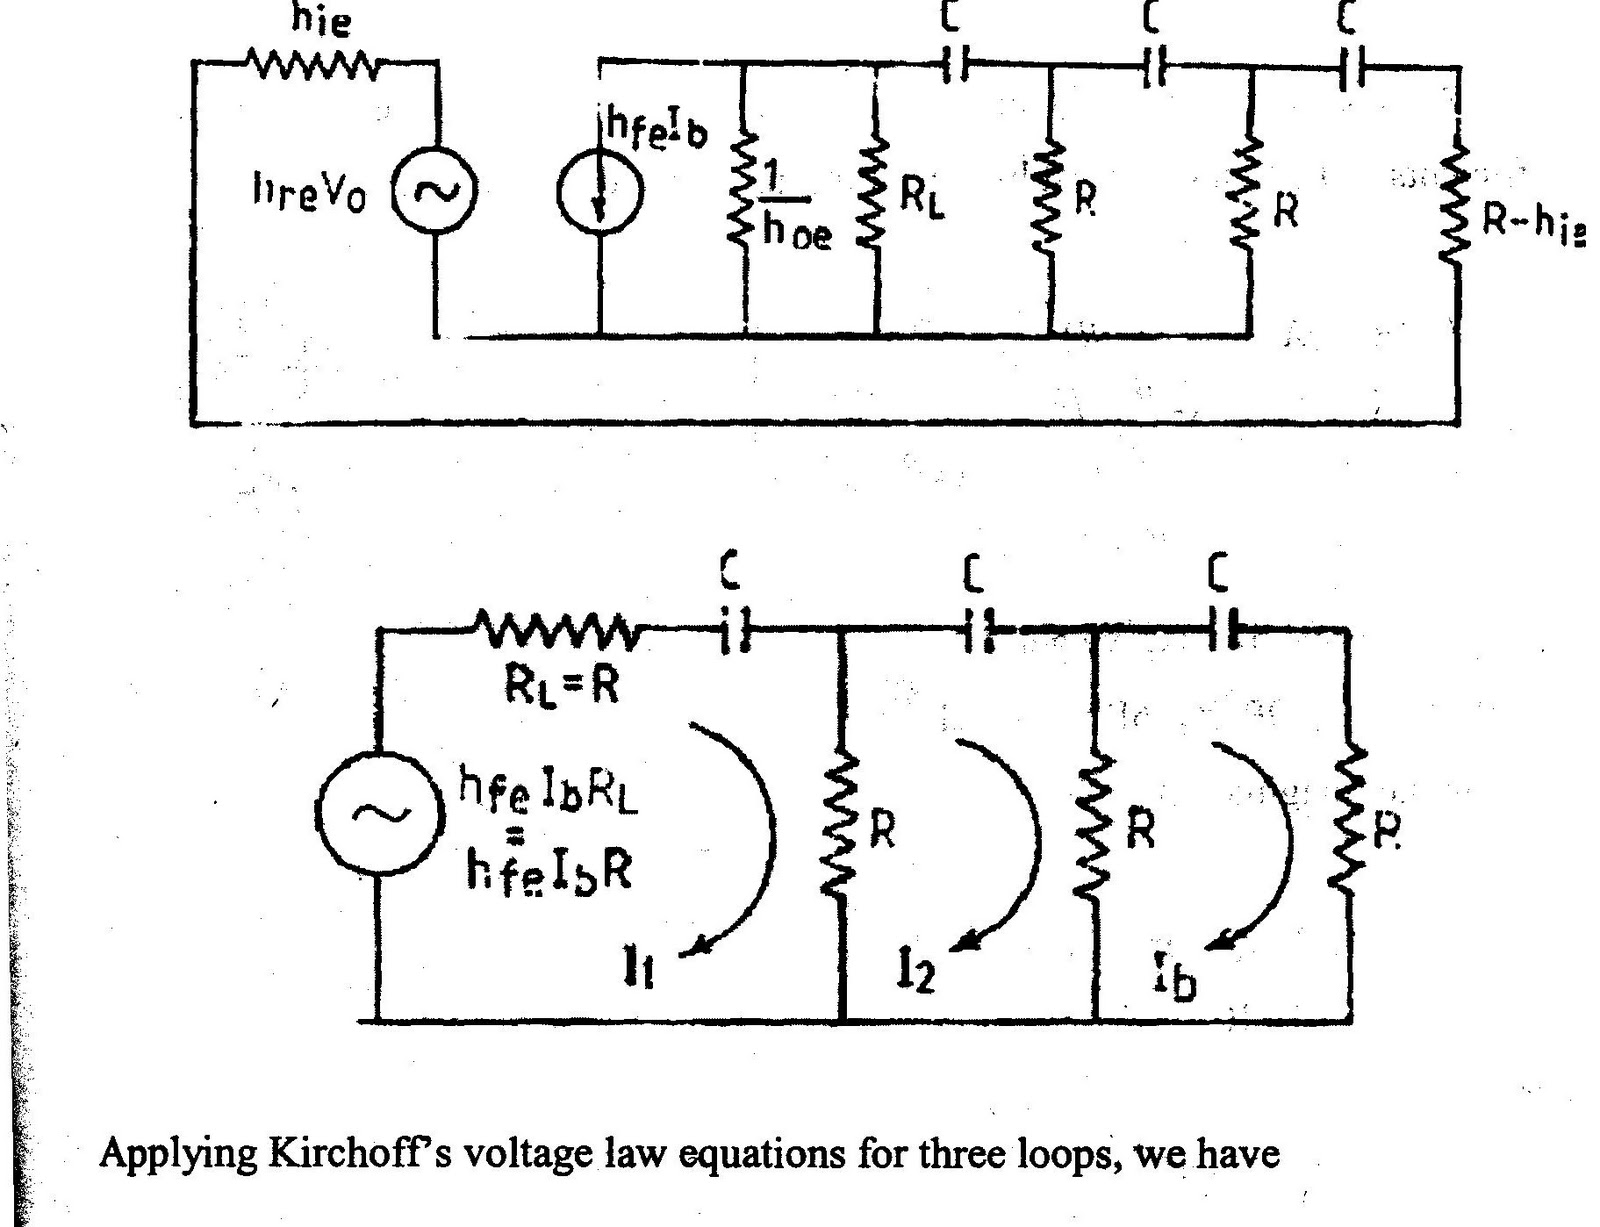
The general equation for the oscillator is given by,


PHASE SHIFT OSCILLATOR

  •     The tuned circuit oscillators are good for generating high frequency. oscillations.
  •     For low frequencies, R-C oscillators are more suitable.
  •     Tuned circuit is not a essential requirement for oscillation. The essential requirement is that there must be a 1800 phase shift around the feedback network and loop gain should be greater than unity.
  •     The 180° phase shift in feedback signal can be achieved by a suitable RC network consisting of three RC sections as shown below.
  •     When a sinusoidal voltage of frequency f is applied to a circuit consisting of resistor R and capacitor C in series, then the alternating current in the circuit leads the applied voltage by certain angle known as phase angle.
  •     The value of R and C may be selected in such a manner that for the frequency f, the phase angle is 60°.
  •     So using a ladder network of three R-C sections, desired 180° phase shift may be produced.

CIRCUIT ARRANGEMENT:

  •     The circuit arrangement of a phase shift oscillator using NPN transistor in common-emitter configuration is shown below.
  •     Here R — R provide dc emitter bias.
  •      RL is the load which controls the collector voltage. Re-Ce combination provides temperature stability and prevents ac signal degeneration.


  •     The output of the amplifier goes to a feedback netwok which conists of three identical R-C sections.
  •      It should be remembered that the last section contains a resistance R=Rhie.
  •     Since, this resistor  is connected with the base of the transistor, the input resistance hie of the transistor is added to it to give  a total resistance.

CIRCUIT ACTION:


  •     Here R-C network produces a phase shift of 1800 between input and output voltages.
  •     Since C-E amplifier produces a phase of 180°, the total phase change becomes 360° or 00 which is the essential requirement of sustáined oscillations.
  •      The RC phase shift networks serve  as frequency determining circuit.
  •      Since only  at a single frequency the net phase shift around the loop will be  360° a sinusoidal  waveform at this frequency is generated.

  •     These oscillators are used for audio frequency ranges LC tuned circuits at low frequencies become too much bulky and expensive moreover they suffer from frequency instability and poor waveform.


FREQUENCY OF OSCILLATIONS:

The equivalent circuit is shown below:

The equivalent circuit can be simplified by making the following assumptions:

1. 1/hoe is much larger than RL, its effect can be neglected.

2. hre of the transistor is usually small and hence h is omitted from the circuit.

3. In practice RL is taken equal to R.


4. The current source is replaced by voltage source using Thevenin’s theorem. The simplified equivalent circuit in also shown above.


 Thus for sustained oscillation, the value of hfe of transistor should be 56.

 TWIN T NETWORK:

  •     The twin “T” network is one of the few RC filter networks capable of providing infinitely deep notch.
  •     By combining the twin “T” with an operational amplifier voltage follower, the usual drawbacks of the network are overcome.
  •     The Quality factor is raised from the usual 0.3 to something greater than 50.
  •     Further, the voltage folllower acts as a buffer, providing a low output resistance; and the high input resistance of the op amp makes it possible to use large resistance values in the “T” so only small capacitors are required, even at low frequencies.
  •      The fast response of follower allows the notch to be used at high frequencies.
  •     Neither the depth of the h nor the frequency of the notch are changed when the follower is added .
  •     Figure low shows a twin T” network  connected to an op amp to form a high Q,60 Hz notch.
  •     The junction of R3 and C3, which is normally connected to ground, i bootstrapped to the output of the follower.
  •     Because the output of the follower is I very low impedance, neither the depth nor the frequency of the notch chang however, the Q is raised in oportion to the amount of si fed back to R3 ai C3.
  •     Figure below shows the response of a normal twin “T” and the response wi the follower added.


ADJUSTABLE TWIN T:

  •     In applications where the rejected signal-might deviate slightly from the null of the notch network, it is advantageous to lower the Q of the network.
  •      This insures some rejection over a wider range of input frequencies.
  •      Figure below shows circuit Where the Q may be varied from 0.3 to 50.
  •     A fraction of the output is fed back to R3 and C3 by a second voltage follower, and the Q is dependent on the amount of signal fed back.
  •     A second follower is necessary to drive the twin from a low-resistance source so that the notch frequency and depth will not change with the potentiometer setting.
  •     Depending on the potentiometer (RL) setting, the circuit in Figure, will have a response that falls in  the shaded area of the frequency response plot.


  •     An interesting change in the high Q twin “T” occurs when components are not exactly matched in ratio.
  •     For example, an increase of 1 to 10 percent in the value of C3 will raise the Q, while degrading the depth of the notch.
  •     If the value of C3 is raised by 1,0 to 20 percent, the network provides voltage gain and acts as a tuned amplifier.
  •     A voltage gain of 400 was, obtained during testing.
  •      Further increases in C3 cause the circuit to oscillate, giving a clipped sine wave output.
  •     The circuit is easy to use and only a few items need be considered for proper operation.
  •     To minimize notch frequency shift with temperature, silver mica, or polycarbonate, capacitors should be used with precision resistors.
  •     Notch depth depends on component match, therefore,. 0.1 percent resistors and 1 percent capacitors are suggested to minimize the trimming needed for a 60 dB notch.
  •      To insure stability of the op amp, the power supplies should be bypassed near the integrated circuit package with .01 mF disc capacitors.

POWER TRANSISTOR

  • Power amplifiers are used to provide power required to drive an current operated load.


  • This load maybe loud speaker in an audio circuit, a horizontal deflection yoke in a video circuit, a magnetic core in a computer memory circuit or a servo motor in an industrial control circuit.


  • These amplifiers operate with large input signals. In a power amplifier, the increased power must come from the D.C power source supplying the active device used in the circuit. Power transistors are used an active devices.


  • Active device in power amplifier, circuit is to reproduce in the output circuit a large power signal that is a replica of the relatively small signal applied to its input circuit, differing only in the amplitude of power


  • Power amplifier circuits are used in both A.F. and R.F. circuits.


  • In power amplifier circuits, the active devices may be operated as class A, class All, class B or class C. Although all classes of operation may he used in both R.F. and AT. Power amplifier circuits. Class C is used primarily in R.F. amplifiers, due to its higher efficiency


  • Depending upon amount of power output required, the active devices used in power amplifiers may be operated as (1) in single (2) in parallel (3) in push pull.

TRANSISTOR POWER RATING

  • Power transistors develop considerable amount of current and this current through the transistor elements themselves, as well as the internal connecting wires will generate a certain amount of heat.


  • This raises the temperature of collector junction and places a limit on the allowable power dissipation P Depending on the transistor type, a junction temperature in the range of 150° to 200°C will destroy the transistor.


  • Data sheets specify these junction temperature as Hence it becomes important with power transistors to bring out this heat at collector junction as quickly as possible and then conduct away from the unit as efficiency as possible.

COMMON BASE CONFIGURATION OF TRANSISTOR


COMMON BASE CONNECTION

In this configuration the input is applied between the emitter and base and the output is taken from the collector and the base. Here the base is common to both the input and the output circuits as shown in Fig.


In a common base configuration, the input current is the emitter current. and the output current is the collector current I The ratio of change in collector


current to the change in emitter current at constant collector-base voltage is called current amplification factor,


In a transistor VEB, IE, VCB, and IC are parameters.


  • These parameters can be interrelated in a number of ways. In these parameters the input current and the output voltage are taken as independent variables.


  • The input voltage and output current are then expressed in terms of these independent variables. And these dependent variables also be expressed in functional relationship.

                                                              i.e., VBE= f1 (IE,VCB)

                                                              IC= f2(In, VCB)


  • Thus the characteristics of a transistor is completely desired by the above two equations. These relationships can be conveniently displaced graphically.


  • The curves thus obtained are known as the static characteristics. The most important static characteristics are the input and the output characteristics

COMMON BASE CIRCUIT


  • A test circuit for determining the static characteristic of an NPN transistor is shown in Fig In this circuit, base is common to both the input and the output circuits.


  • To measure the emitter and the collector currents mull ammeters are connected in series with the emitter and the collector circuits.


  • Voltmeters are connected across the input and the output circuits to measure VBE and VCB There are two potentiometers R1 and R2 to vary the supply voltages VCC and VBE.


  • It is a curve, which shows the relationship between the emitter current, I and emitter-base voltage V at constant collector-base voltage V This method of determining the characteristic is as follows.


  • First by means of R1, a suitable voltage is applied to VCB from VCC. Next, voltages VBE is increased in a number of steps and corresponding values of IE are noted.


  • The emitter current is taken on the Y-axis and the emitter base voltage is taken on the X-axis. Fig 2.12 shows the input characteristic for germanium and silicon transistors.


The following points may be noted from the characteristics curves.

1.This characteristic may be used to find the input resistance of a transistor.The input resistance (ri) value is    given by the reciprocal of the input characteristic curve.

2.The emitter current IE increases rapidly with small increase in emitter- base voltage. It means that the input resistance is very high.

3.The emitter current is dependent of collector voltage.

OUTPUT CHARACTERISTICS


  • It is a curve which shows the relationship between the collector current IC and the collector-base voltage VCB at constant emitter current IE. This method of determining the characteristic is as follows.


  • First, by means of R2 a suitable voltage is applied to the base and the emitter. Next, VCB is increased from zero in a number of steps and corresponding values of IC are noted.


  • The above whole procedure is repeated for different values of IE for obtaining family of curves.


  • The collector-base voltage is taken the X-axis. Fig shows the family of output characteristics at different emitter current values.


  • The following points may be noted from the family of characteristic curves.


  • The collector current IC varies with VCB only at very low voltages.


  • This characteristic may be used to find the output resistance (rO)


  • A very large change in collector-base voltage produces small change in collector current. It means that the output resistance is very high.


  • The collector current is constant above certain values of collector-base voltage. It means that IC is independent of VCB and depends upon IE only.

The output characteristics may be divided into three regions

1. The active region

2. Cut-off region

3. Saturation region

Active region: In this region the collector junction is reverse biased and the emitter junction is forward biased. In this region when IE= 0, IC = ICO. This reverse saturation current remains constant and is independent of collector voltage V as long as is below the break down potential. When emitter current flows in the emitter circuit then a fraction (- IE) of this current reaches the collector. Hence IC = - IE + ICO. Thus in the active region the collector current is independent of collector voltage and depends only upon the emitter current. But due to Early effect there is a small increase (0.5%) in IC with increase in VCB

Saturation region: The region to the left of the ordinate VCB = 0 is called the saturation region. In this region both junctions are forward biased. This is also called as bottomed region because the voltage has a fallen near the bottom of the characteristic where VCB = 0. In this region IC increases rapidly with even small increase VCB in as shown in Fig

Cut-off region: The region below the IE= 0 characteristic, for which the emitter and collector junction are both reverse biased, is called cut-off region. This portion of characteristic is not coincident with the voltage axis as shown in Fig.


UNBIASED TRANSISTOR


  • An unbiased transistor means a transistor with no external voltage (biasing) is   applied.   Obviously,  there   will   be  no   current  flowing  from  any   of  the transistor leads.


  • Since transistor is like two pn junction diodes connected back to back, there     are  depletion  regions  at  both  the  junctions,  emitter  junction  and  collector junction, as shown in the Fig

  • During  diffusion  process,  depletion  region  penetrates  more  deeply  into  the lightly  doped  side  in  order  to include  an  equal  number  of  impurity  atoms  in the each side of the junction.


  • As shown in the Fig. depletion region at emitter junction penetrates less i the heavily doped emitter and extends more in the base region.

  • Similarly, depletion region at collector junction penetrates less in the heavily doped collector and extends more in the base region.

  • As collector is slightly less doped than the emitter, the depletion layer Width  at the collector junction is more than the depletion layer width at the emitter junction.

Pulse Width Modulation (PWM)


Pulse width modulation is one of the most widely used and versatile output techniques available to the embedded designer. This technique is used to generate analog voltage levels and waveforms, implement speed control, and transmit data.

Pulse width modulation consists of a digital signal of fixed period (the low to high transition occurs at a fixed time interval.) The width (W) of the pulse varies between 0 sec and the period (T). The duty cycle (D) of the signal is the ratio of the pulse width to period.


A PWM signal can be generated is several ways using a PIC microcontroller. The most basic method is to write source code than manually toggles at pin. For simple applications this method will suffice. However, more complex applications can not afford the microcontroller bandwidth needed to implement the software toggling method. Microchip microcontrollers equipped with a CCP and ECCP module have a hardware PWM generator build in. The designer simply configures the duty cycle and frequency and these modules take care of the rest.

Document Description

AN847 RC Model Aircraft Motor Control

AN654 PWM, A Software Solution using the 16CXXX Devices

AN594 Using the CCP Modules

AN893 Low-Cost Bidirectional Brushed DC Motor Control Using the PIC16F684

AN538 Using PWM to Generate Analog Output

AN906 Stepper Motor Control Using the PIC16F684

AN901 Using the dsPIC30F for Sensorless BLDC Control

AN857 Brushless DC Motor Control Made Easy

AN900 Controlling 3-Phase AC Induction Motors Using the PIC18F4431

TB081 Soft-Start Controller for Switching Power Supplies

Field Effect LCD


  The  Fig.  shows  the  field  effect  liquid  crystal  cell.  It  consists  of  two  glass plates, a liquid crystal fluid, polarizers and transparent conductors. The liquid crystal
fluid is sandwiched between two glass plates. Each glass plate is associated with light polarizer. The light polarizers are placed at right angle to each other. In the absence
of electrical excitation, the light coming through the front polarizer is rotated through
900  in  the  fluid  and  passed  through  the  rear  polarizer.  It  is  then  reflected  to  the viewer by the back mirror as shown in Fig.


SOLAR CELLS


Solar  cells  that  we see  on calculators  and  satellites  are  photovoltaic  cells or modules (modules are simply a group of cells electrically connected and packaged in Photovoltaic,  as  the  word  implies  (photo  =  light,  voltaic  =  electricity),  convert directly into  electricity.  When  we consider  that  the  power  density  received from  at sea level is about 100 mW/cm (1kW/rn it is certainly an energy source that requires further research and development  to maximize the  conversion  efficiency from solar
to electrical energy.


The Fig shows the basic construction and cross section of solar cell. As shown
the top view, every effort is made to ensure that the surface area perpendicular to
the sun is maximum. The surface layer of p-type material is extremely thin so that
light   can;   penetrate   to   the   junction.   The   nickel-plated   ring   around  the   p-type material is the positive output terminal, and the plating at the bottom of the n-type   material is the negative output terminal. Usually, silicon is used as a semiconductor  material.


When light strikes the cell, certain portion of it is absorbed within the semiconductor material.  This  means  that  the  energy  of  the  absorbed  light  is  transferred  to  the
 semiconductor. This photon light energy collides with, a valence electron and imparts
to it sufficient energy to leave the parent atom. This results in the generation of free electrons and holes. This phenomenon will occur on each side of the junction. In the   p-type  material, the newly  generated  electrons  are  minority  carriers  and  will  move rather  freely  across  the  junction  as  explained  for  the  basic  p-n  junction.  A  similar discussion  is  true  for  the  holes  generated  in  the  n-type  material.  The  result  is  an increase in the minority carrier flow which is opposite in direction to the conventional forward current of a p-n junction.


The Fig shows the characteristics of solar cell. At vertical axis, V = 0 and it is short
circuit condition. The short circuit current is represented by notation Isc. Under open   circuit  condition  I  =  0  and  photovoltaic  voltage  V  will  result.  This  is  a  logarithmic function of the illumination, as shown in Fig.


Selenium  and  silicon  are  the  most  widely  used  materials  for  solar  cells,  although selenium arsenide, indium arsenide, and cadmium sulphide, among others, are also   used.


However, silicon has a higher  conversion  efficiency and greater stability and is  less subjected  to  fatigue.  It  also  has  excellent  temperature  characteristics.  That  is,  it withstands   extreme  high   or   low   temperatures   without   a  significant   drop-off   in efficiency.  The  efficiency  of  operation  of  a  solar  cell  is  determined  by  the  electrical power out divided by the power provided by the light source. It is given by


Typical levels of efficiency range from 10 to 40%.

Application of solar cell

Solar cells find many applications such as
  • Satellites
  • Automated street light
  • Calculators
  • Emergency light

LCD Display Driver Circuit


 Fig.  shows the  circuit  for  driving  LCD  seven  segment  y  using  IC  4543B.The 4543B BCD-to-7 segment latch/decoder/driver is  designed for liquid crystal Pins A,
B,  C  and  D  represent  BCD inputs  with  A as  a least  significant  bit  (LSB)  as  a most significant bit (MSB). Pins a through g are the seven segment outputs. It has three
control terminals LD (Latch Disable), PH (Phase), and BL (Blank). In internal use the
LD  terminal  is  held  high  and  BL  terminal  is  tied  low.  The  state  of  the  PH  terminal depends on the type of display that is being driven. For driving LCD displays, square
wave (about 60Hz swinging fully between the GND and Vcc values) must b applied to
the phase terminal.


The display can be blanked by simply driving the BL terminal to the logic high state. When the LD terminal is in its normal high state, BCD inputs are decoded and fed directly to the seven segment output terminals of the IC. When the LD terminal    is pulled low, the BCD input signals that are present at the moment of transition are latched into memory and fed to the seven segment outputs.

The Fig shows how above circuit can be used to drive a 4-digit  nonmultiplexed, 7-segment LCD display. Here, BCD input for each display is latched  in the corresponding latch. The latch enable signals are activated using 2: 4 decoder in synchronization with the BCD inputs.


PHOTO CONDUCTIVE CELL


 The photo conductive cell is a semiconductor device whose resistance varies inversely  with  the  intensity  of  light  that  falls  upon  its  photosensitive material.  Fig. shows typical photoconductive cell and the schematic symbol. These devices are also  called photoresistive cells or photoresistors, since the change in conductivity appears
as a char in resistance.


The device is constructed by vapour depositing or sintering the
photoconductive  material  onto  a  ceramic  substrate.  The  photoconductive  material
used  is usually  cadmium  compounds  such  as  cadmium  suiphide  (CdS)  or cadmium selenide   (CdSe).  This   photoconductive   material   with   substrate  is   enclosed   with suitable  enclosure  taking  photoconductive  material  contacts  as  metallic  leads.  The    glass   window   or   lens   is   added   at   the   top   of   the   enclosure   to   pass   light   on photoconductive material.


As  we  know  that  in  semiconductors,  energy  gap  exists  between  conduction electrons  and  valence  electrons.  When  photons  are  absorbed  in  a  photoconductive material, due to impartion of the photo energy, electrons are excited into conduction   band, reducing the resistance of the photoconductive material, as shown in the Fig


Photo-Diode


 The  photodiode  is   a  semiconductor  p-n  junction  device  whose  region  of operation  is  limited  to  the  reverse  biased  region.  The  Fig  shows  the  symbol  of photodiode while the Fig shows the working principle of photodiode.

The   photodiode  is   connected  in  reverse   biased   condition.   The  depletion region width is large. Under normal condition, it carries small reverse current due to
minority  charge  carriers.  When  light  is  incident  through  glass  window  on  the  p-n junction, photons in the light bombard the p-n junction and some energy is imparted
to  the  valence  electrons.  Due  to  this,  valence  electrons  are  dislodged  from  the covalent   bonds   and   become   free   electrons.  Thus   more   electron-hole   pairs   are generated.  Thus  total  number  of  minority  charge  carriers  increases  and  hence  the reverse current increases. This is the basic principle of operation of photodiode.


The  reverse  current  without  light  in  diode  is  in  the  range  of  micro  amperes.  The change  in this current  due to the light  is  also in the  range of micro amperes. Thus     such a change can be significance observed in the reverse current. If the photodiode
is  forward  biased,  the  current  flow through  it  is  in  mA.  The  applied  forward  biased voltage takes the control of the current instead of the light. The change in forward
current due to light is negligible and can not be noticed. The resistance of forward
biased diode is not affected by the light. Hence to have significant effect of light on
the  current  and  to  operate  photodiode  as  a variable  resistance  device,  it  is  always connected in reverse biased condition.


The Fig shows the small signal model for photodiode. Photodiode is represented by an ideal junction diode in parallel with a current source which is proportional to the light intensity.


Advantages


The advantages of photodiode are,

1.Can be used as variable resistance device.

2.Highly sensitive to the light.


3.The speed of operation is very high. The switching of current and hence the resistance value from high to low or otherwise is very fast.

Disadvantages

The various disadvantages of photodiode are,

1.The dark current is temperature dependent.

2.The overall photodiode characteristics are temperature dependent hence have poor

3.temperature stability.

4.The  current  and  change  in  current  is  in  the  range  of  1  which  may  not  be
sufficient to drive other circuits. Hence amplification is necessary.

Photodiode Applications

The two commonly used systems using photodiode are alarm system and a counting system.

ESC study highlights software checking


A recent study carried out by a leading static analysis tool provider, PRQA, showed that, perhaps not surprisingly, engineers aren't as efficient at identifying code violations as a dedicated tool. However, while the headline results may seem contrived, the underlying premise is that an engineer's time and skills are better used in resolving the subjective issues that arise from automated code inspection.

The study is based on the results of PRQA's Developers' Challenge, held at the Embedded Systems Conference in Silicon Valley earlier this year, which targeted engineers with a "genuine interest in writing high quality code."

While its primary objective is to unashamedly demonstrate the value of automated code inspection and review, it highlighted the significant gap between engineers' ability to (rapidly) identify coding violations in a sample of C/C++ source code provided, which compiled with only a few warnings, yet contravened a number of recognized coding standards.

The inability for compilers to do a good job of reviewing code isn't news, neither is the fact that software can check software quicker than wetware, but the follow-on conclusion is that engineers are still needed to apply discretion to the results. In the challenge, 50 engineers of varying ability spent around 30 minutes (although one particularly diligent participant returned the sample the following day) to identify between none and 33 issues contained within the code.

The automated tool took considerably less time to identify 120. However, once the less subjective issues were identified and addressed (by engineers) there remained a number of violations that could only be assessed in context; something that even PRQA admits isn't possible using an automated approach.

In PRQA's defense, the intention isn't to replace code reviews but to expedite them. It's only fair to point out too that the static analysis tool was configured to mimic the compiler's own settings, as well as modifying the coding standards against which it was analyzed. This was intended to exclude violations that were perhaps not relevant to the code's level of completion, as well as avoiding compiler-centric issues that would otherwise be omitted.

Scopes cover hi-speed/hi-fidelity domains at ESC


MANHASSET, NY -- Tektronix, Inc. has introduced a mixed-domain oscilloscope that delivers the functionality of an scope and a spectrum analyzer in a single instrument. And Rohde & Schwarz has enhanced its real-time digital trigger scope for analyzing extremely small signals with high fidelity. Both companies will exhibit their wares at the Embedded Systems Conference, Boston (Sept. 26 to 29).

Tek’s MDO4000 Series enables time-correlated analog, digital and rf signals to be captured in a complete system view.

“We believe that the MDO4000 Series is breaking down the barrier between time and frequency domains,” said Roy Siegel, general manager, Oscilloscopes at Tektronix. “It fundamentally changes what’s involved in debugging designs with rf where there is a need to correlate events in the frequency domain with the time domain phenomena that caused them.”

The  MDO4000 allows users to capture time-correlated analog, digital and rf signals across 4 analog, 16 digital and 1 rf channel. The rf input frequency range extends up to 6 GHz and provides a capture bandwidth of 1 GHz at all center frequencies, 100 times wider than typical spectrum analyzers, according to Tektronix. 

Time correlation measurements between domains enables engineers to understand delays and latencies between command/control events in their designs and the relative changes in the rf spectrum of a signal at any point in time within a long acquisition. A proprietary Spectrum Time function enables the view of the rf spectrum for any point in the acquired signal while simultaneously showing analog, digital and/or decoded buses.

Tektronix has 26 patents pending for integrating the time and frequency domains in a single instrument. The MDO4000 Series start at $19,900.

More details on Tektronix' MDO4000 here.

Meanwhile the Rohde & Schwarz RTO Scope Series enables signals to be displayed with the least possible trigger jitter. The company is aiming the digital scope for debugging biomedical sensors and equipment.

“The RTO oscilloscope family is well-suited for biomedical measurements based on its low noise front-end performance and a/d converter to deliver accurate signal acquisition,” said Mike Schnecker, business development manger at Rohde & Schwarz.

The digital trigger in the RTO Scope Series does not need to “re-arm” as in analog triggers, allowing every sample to trigger data acquisition and thus avoid missing events.

Models in the RTO Scope Series allow between 2 or 4 channels, and 1 GHz or 2 GHz bandwidths. Sampling rates are up to 10 Gsample/s, enabled by the company-designed and-built high-speed ASIC, deep waveform acquisition memory and the single-core A/D converter, according to R&S. The low-noise front end makes precise measurements possible even at the lowest vertical setting, according to Schnecker.

One "cool factor" in the RTO series is that engineers can drag & drop signal icons anywhere on the 10.4-in touch display to keep track of channels,  math waveforms and reference signals--all on a single screen.

Signal icons show waveforms in real time as thumbnails that can be dragged and dropped to the main display as needed. Users can activate multiple diagrams and a SmartGrid function helps in organizing the screen. Semi-transparent dialog boxes allow waveform diagrams on the RTO retain their original size. Semi-transparent overlays map processed signals onto a signal flow diagram, for example.

ESC Boston attendees will be able to win scopes in the giveaway session. Tektronix will raffle off a MSO2024 scope; LeCroy will give away a WaveAce 102 oscilloscope. Rohde & Schwarz's Mike Schnecker will be part of training sessions at ESC Boston. He will will run a seminar on increasing sensitivity for measuring signal details of low amplitude signals.

Register for ESC Boston here.

Followers